Response Rate Widget
Response Rate Widget
Overview
The Response Rate Widget helps you quickly understand how your survey is performing by showing how many people responded compared to how many received it. It provides a high-level view of engagement directly within your dashboard, making it easy to track survey effectiveness at a glance.
Key Use Cases
- Monitor overall survey performance
- Track engagement across different distribution channels (Email, Link, SMS, etc.)
- Identify areas where response rates may be low or dropping off
- Compare surveys delivered vs responses received
- Understand participation and completion efficiency
Understanding the Widget
The widget provides a quick summary of key response metrics:
- Delivered – Number of survey invitations sent
- Responses – Total responses received
- Response Rate (%) – Percentage of completed responses
- Avg. Time – Average time taken to complete the survey
Widget Variations
- When you select a specific channel (e.g., Email), the widget shows delivery and response performance for that channel.
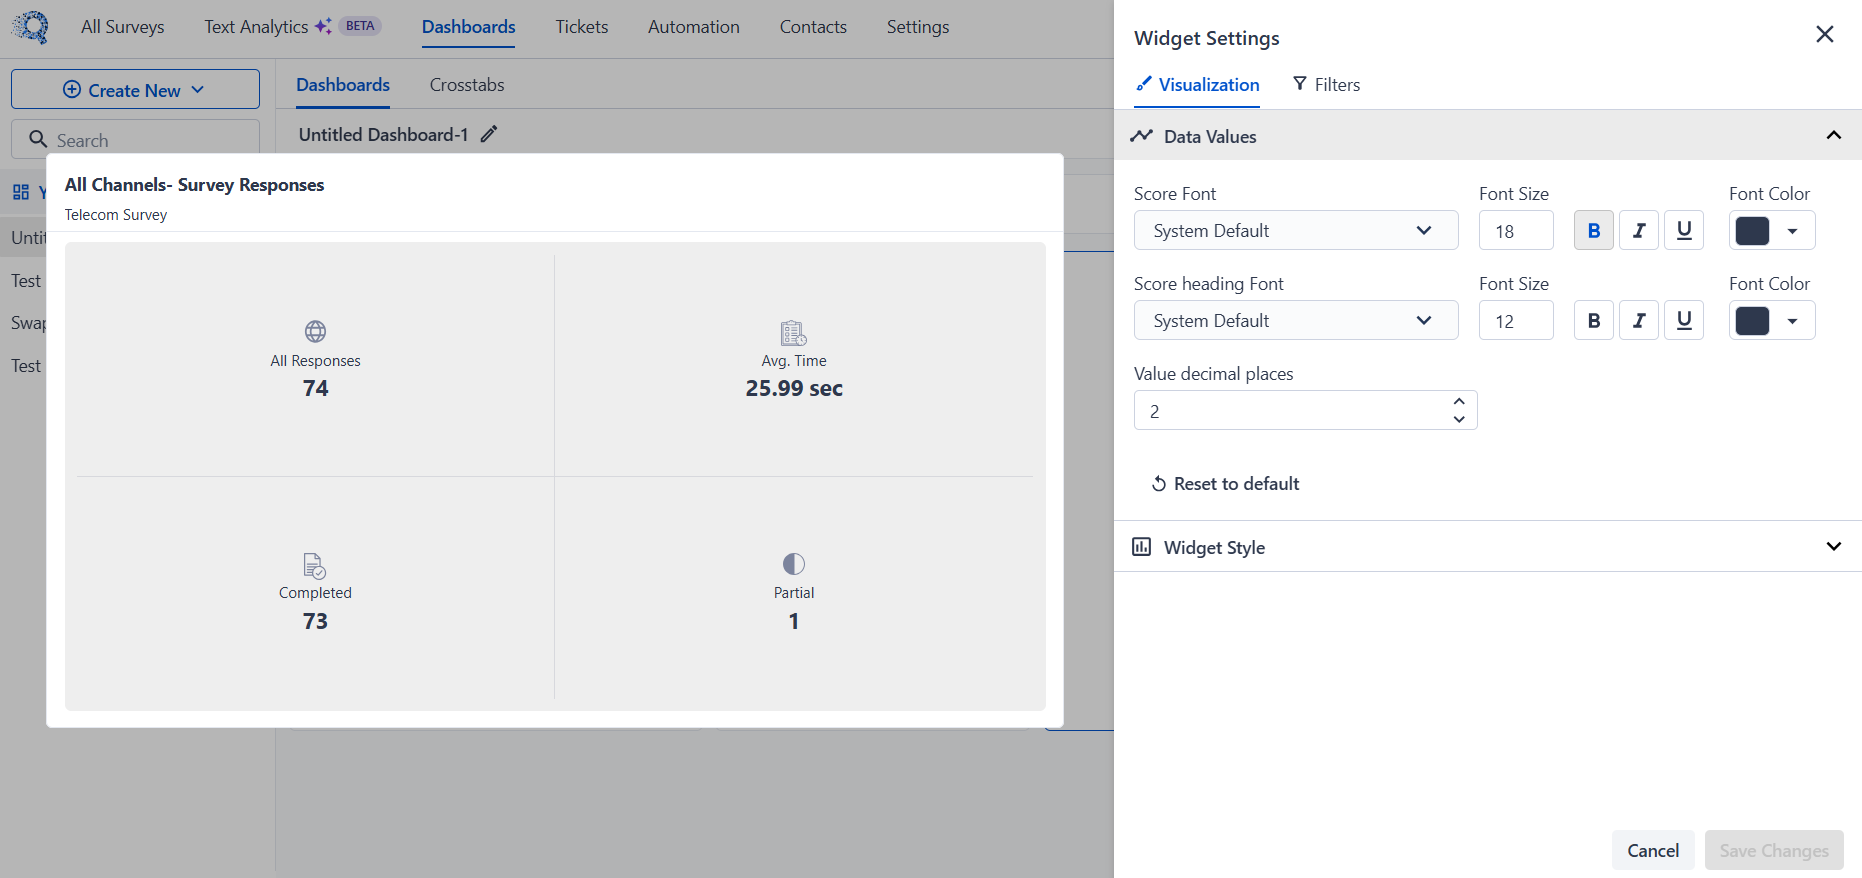
- When you select All Channels, the widget displays an aggregated view, including:
- All Responses – Total responses across all channels
- Completed – Fully completed responses
- Partial – Incomplete responses
- Avg. Time – Average completion time across all responses
Widget Details
Enable Detailed View in Widget Settings to access deeper insights:
- Completed vs Partial responses
- Open Rate and Click Rate
- Bounce and Unsubscribe data
Managing the Widget
Access widget options from the menu on the widget:
- Edit settings and visualization
- Apply filters
- Customize display (font, format, etc.)
- Delete widget if no longer needed
Related Articles
Share Overview
Overview Once you have built your survey, the next step is distributing it to the right audience through the right channel. SurveySensum provides a wide range of distribution channels — from email and SMS to website embedding and social media — so ...Partial Responses in Surveys
Overview A Partial Response is created when a respondent starts answering a survey but does not complete it. When partial response collection is enabled, SurveySensum can save and sync these incomplete responses, making them available for reporting, ...Product Experience (PX) Surveys
What is Product Experience? Product Experience (PX) is the overall quality of every interaction a customer has with your product—from first use to long-term engagement. It’s not just about features, but how easy, valuable, and satisfying the product ...Automation
Overview The Automation feature lets you build automated workflows that save time and ensure consistent outreach — from sending surveys to importing contacts and exporting responses. This article walks you through the Automation tab, the types of ...Survey Throttling
Throttling Overview The Throttling feature helps you control how frequently a contact receives surveys within a defined time period. This prevents over-surveying, reduces survey fatigue, and ensures better response quality by spacing out survey ...